Your data shouldn't have to be copy-pasted every time.
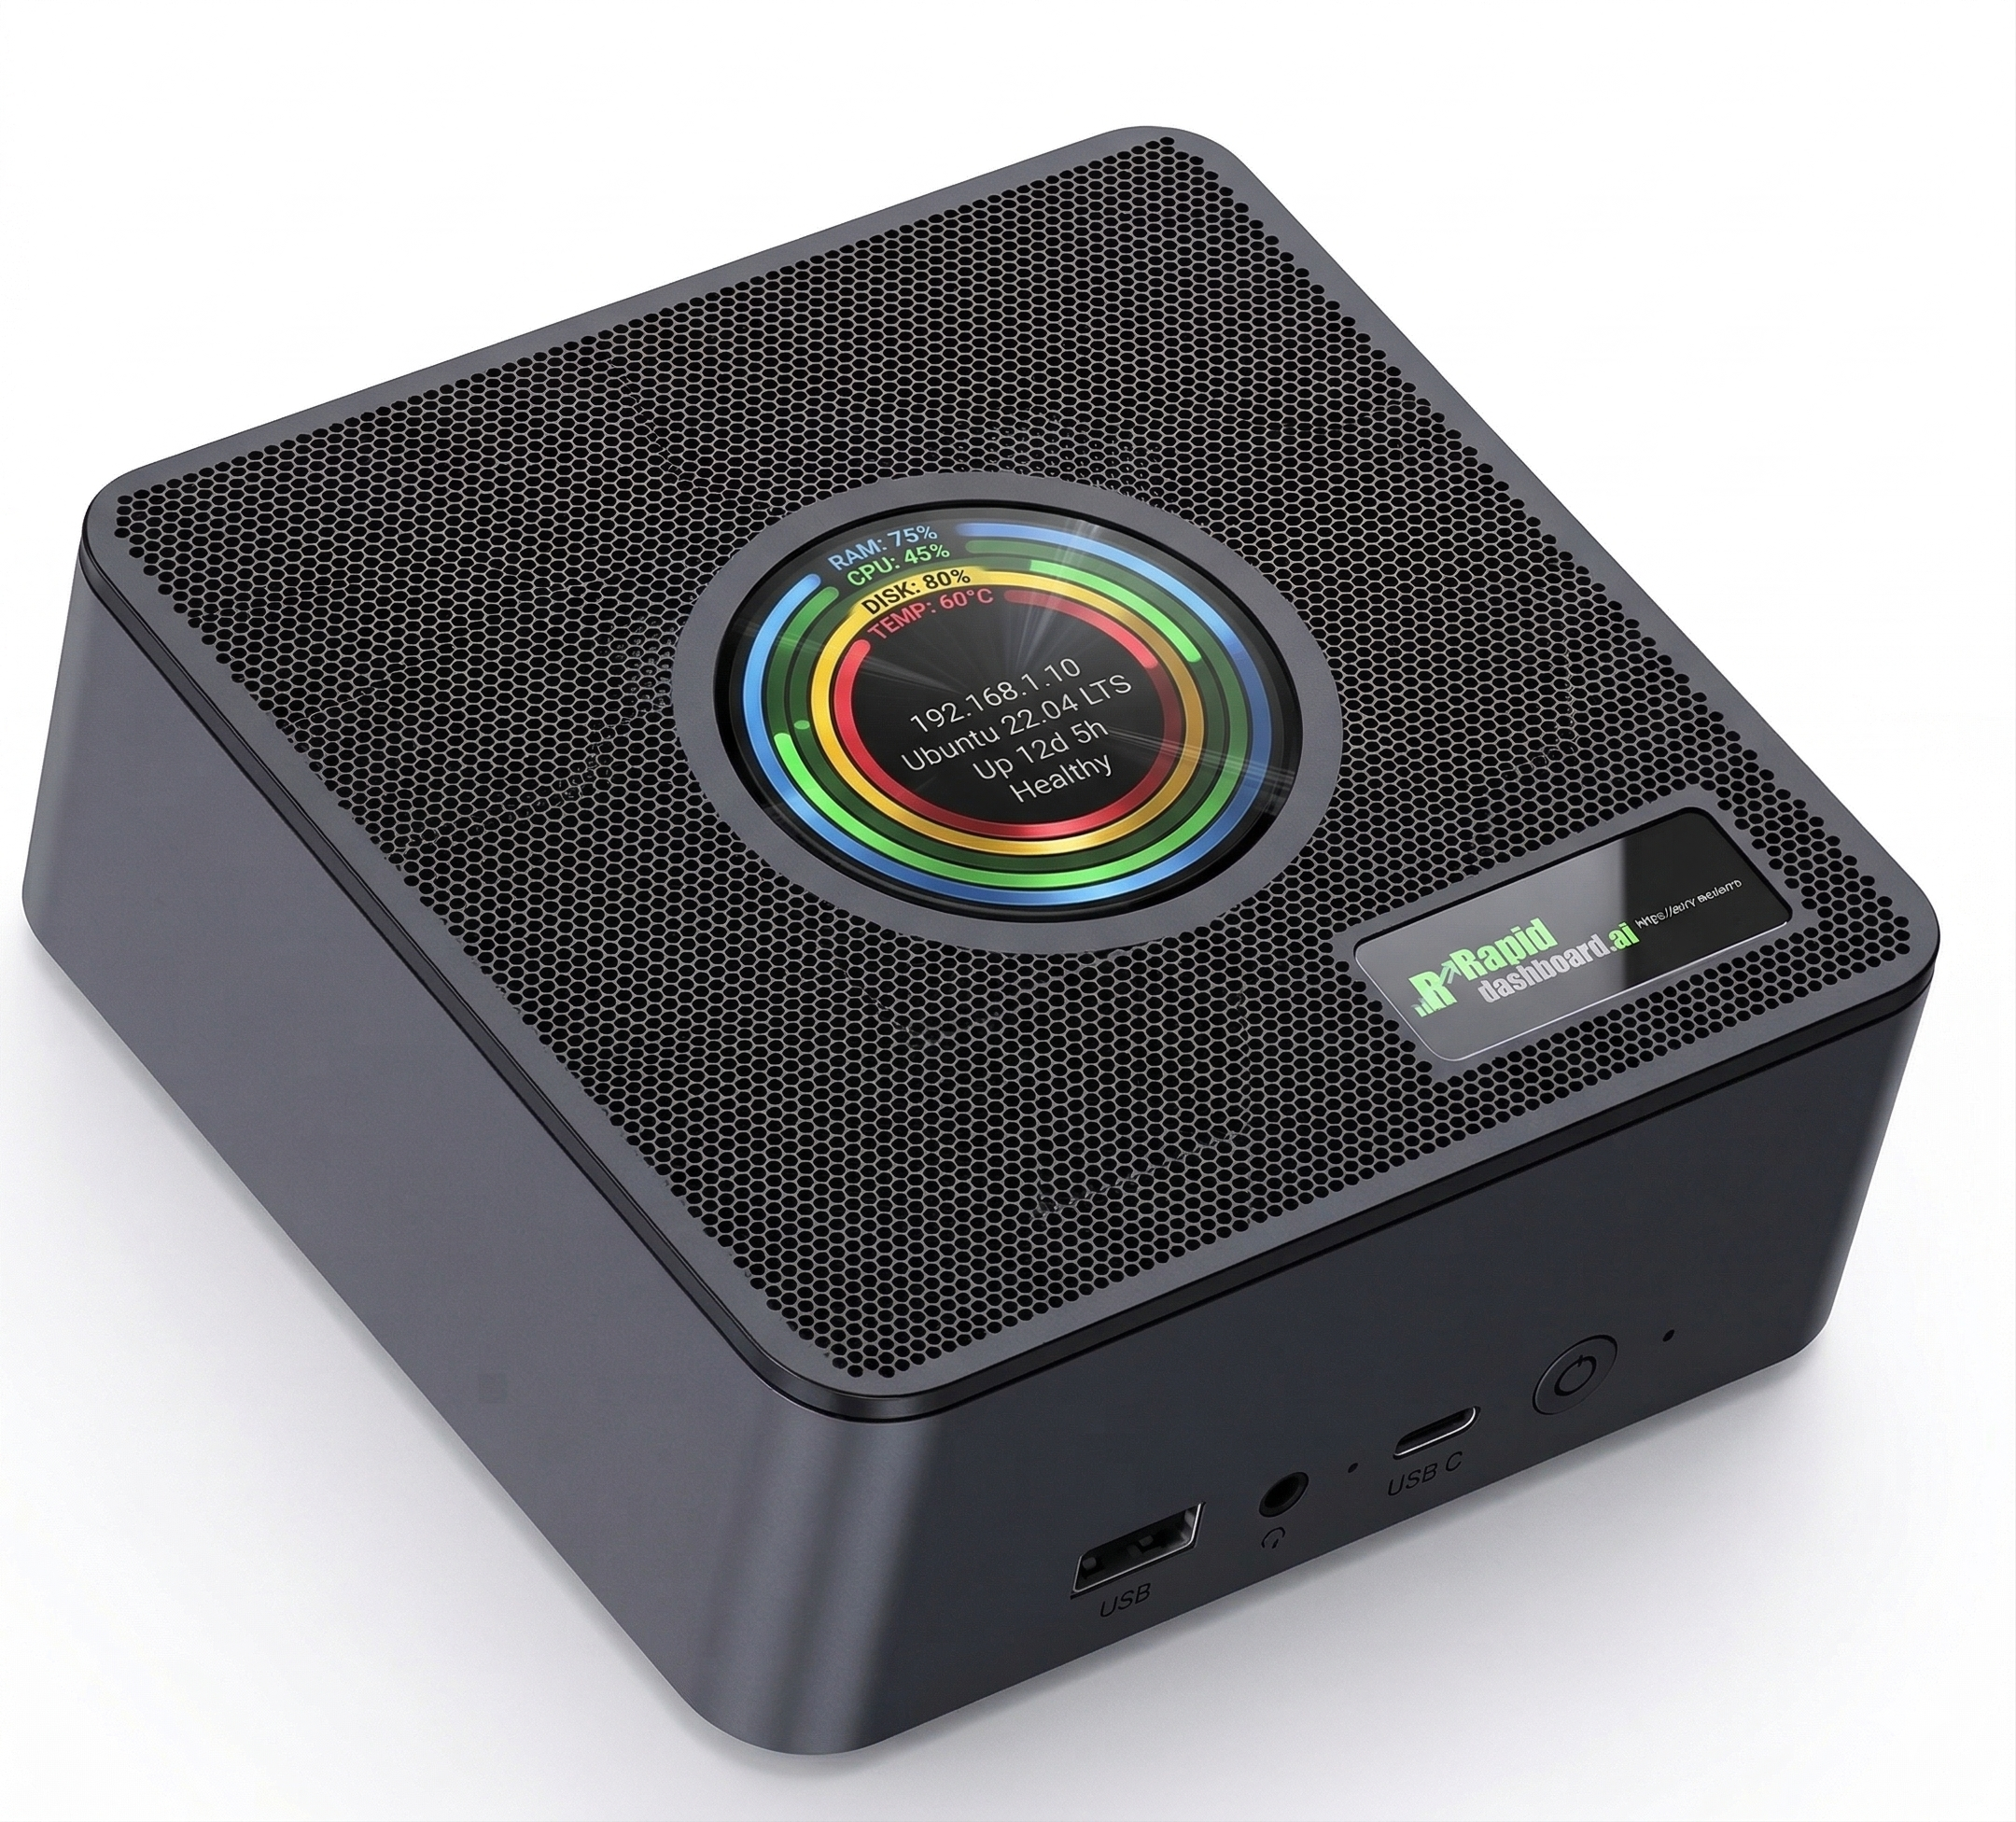
Most businesses are one person away from their own numbers. RapidDashboard fixes that at the source: your systems sync into the AI in a Box once. Then every plain-English question becomes a live dashboard your whole team can open.
You are the integration.
Every time someone needs an answer, a real person has to open each system, export the data, drag it into a chat window, and hope the numbers match. Then do it all over again for the next question.
Ask. Share. Open the live dashboard.
Type a plain-English question. Hit share and your team gets an email with the live dashboard URL. They open it and see the same numbers you do, right now. The cycle below shows it for Sales, Operations, HR, and Finance.
- Reading 4 connected systems (Spreadsheet, QuickBooks, HRIS, Ops)
- Reconciling against the same source rows
- Picking the right charts and KPIs for the question
- Rendering live dashboard, ready to share
$302K
$87K
$58K
$40K
The difference, side by side.
The same question. Radically different overhead.
See it on your own data.
Every demo is run against your actual industry, your actual system types, and your actual questions. Bring your IT reviewer. We speak both languages. Most clients have working dashboards within their first week of connected data.